Average used car prices increased by 3.2% in June to £17,756, rising at the fastest rate in eight months, according to the latest data from Auto Trader.
The Auto Trader Retail Price Index shows that over the last 39 months of used car price growth, average used car prices have increased by £3,900.
Although retail prices in June softened slightly on a month-on-month (MoM) basis, decreasing -0.3% on May, this is near to seasonal norms, with prices falling as much as -0.9% over the same period in 2019.
The strength and stability in second-hand retail values is continuing to be driven by the imbalance in market dynamics.
Indeed, used car supply, which has been affected since the start of the pandemic and the subsequent shortfall in new car production, was down -4.1% YoY in June, while consumer demand was up 2.3%.
As well as helping to fuel price growth, this imbalance is supporting a profitable used car market, with Auto Trader’s Market Health metric recording a 6.7% YoY increase last month.
Richard Walker, Auto Trader’s director of data and insight, said: “The used car market has enjoyed a strong first half of the year, with the rise in retail values doing little to dampen consumer demand, which has been reflected in the very strong levels of engagement we’ve seen on our marketplace over recent months.
“Although the current health of the economy does add a degree of uncertainty for the months ahead, based on what we’re currently tracking across the market, our outlook for the rest of 2023 remains an optimistic one.”
Top 10 used car price growth (all fuel types) | June 2023 vs June 2022 like-for-like

| Ranks | Make | Model | June 23 Average Asking Price | Price Change (YoY) | Price Change (MoM) |
|---|---|---|---|---|---|
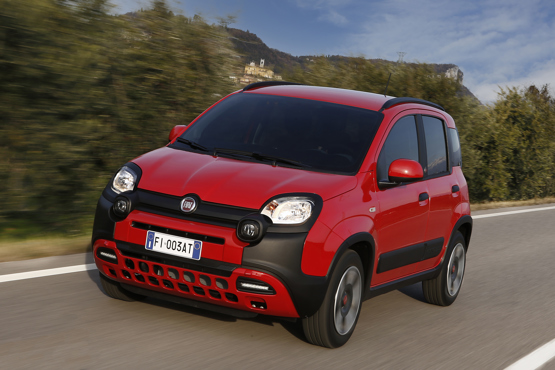
| 1 | Fiat | Panda | 6,609.00 | 17.00% | 0.00% |
| 2 | Peugeot | Partner Tepee | 10,081.00 | 15.90% | 0.40% |
| 3 | Volvo | XC70 | 11,372.00 | 15.80% | 2.40% |
| 4 | Renault | Twingo | 5,210.00 | 14.70% | -2.00% |
| 5 | Suzuki | Jimny | 11,008.00 | 14.60% | -0.70% |
| 6 | Volkswagen | up! | 9,136.00 | 13.80% | -0.70% |
| 7 | Hyundai | i10 | 8,444.00 | 13.60% | -0.50% |
| 8 | Renault | Scenic | 5,843.00 | 12.40% | 1.70% |
| 9 | Hyundai | i30 | 10,399.00 | 12.20% | 0.70% |
| 10 | Citroen | Berlingo | 12,732.00 | 11.80% | 0.20% |
Top 10 used car price contraction (all fuel types) | June 2023 vs June 2022 like-for-like

| Rank | Make | Model | June 23 Average Asking Price | Price Change (YoY) | Price Change (MoM) |
|---|---|---|---|---|---|
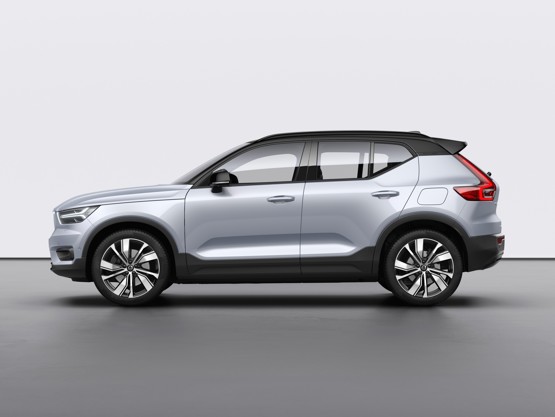
| 10 | Volvo | XC40 | £32,123 | -9.20% | -1.60% |
| 9 | Land Rover | Defender 90 | £64,607 | -9.80% | -1.20% |
| 8 | DS AUTOMOBILES | DS 3 CROSSBACK | £18,511 | -9.90% | -1.70% |
| 7 | BMW | 8 Series | £47,610 | -11.80% | -0.40% |
| 6 | Porsche | Taycan | £95,226 | -17.80% | -0.60% |
| 5 | BMW | i3 | £17,974 | -22.90% | -4.00% |
| 4 | Nissan | Leaf | £15,236 | -23.00% | -3.90% |
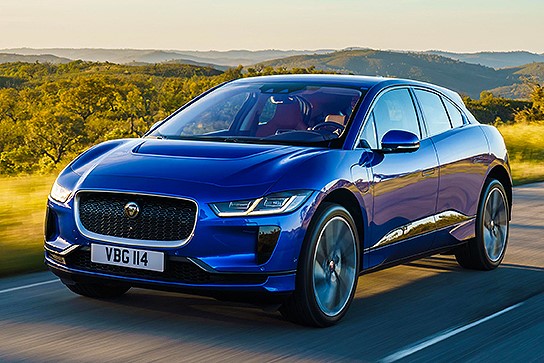
| 3 | Jaguar | I-PACE | £39,056 | -23.00% | -2.80% |
| 2 | Tesla | Model S | £34,853 | -24.70% | -2.40% |
| 1 | Renault | Zoe | £14,854 | -25.00% | -2.30% |
Price parity edges closer as EV values continue contraction

Looking at the pricing data at a more granular level, June marked another month of contraction for electric vehicles (EVs), with the average retail value (£31,430) falling -19.1% YoY.
It’s the sixth consecutive month of YoY decline, with average EV prices falling circa £5,000 since January (£36,179) and nearly £9,500 since their peak in July 2022 (£40,728).
The price contraction represents what is still a maturing market entering a new phase; finance and leasing terms of brand-new electric cars bought three-four years ago have ended, which has, as expected, resulted in a very strong increase in supply over recent months.
While consumer demand for second-hand EVs has been robust, up 6% YoY in June, it’s been unable to keep pace with the sharp increase in availability – supply growth was up 174% YoY last month.
It’s this imbalance that’s caused prices to contract recently, as opposed to any loss in consumer appetite.
The supply growth levels are softening however – June was the lowest level in nine months and down significantly on the 303% increase recorded in January.
As such despite June marking the highest rate of YoY price contraction recorded by the Index, there are strong signs of used EV values beginning to stabilise, with June also seeing the lowest level of MoM price contraction (-0.9%) since August last year.
The drop in average EV prices is rapidly closing the upfront price gap between many electric models and their ICE counterparts, and in some cases, has already made them cheaper.
For example, a three-year-old electric Jaguar I-Pace was £600 cheaper than a traditionally fuelled F-Pace in April, but in June the gap grew to nearly £2,000.
Following the price realignments made by Tesla, the average price of a used three-year-old Model 3 (£30,700) is now only £3,200 more expensive than a BMW 3 Series of the same age – down from £3,600 in April, and a whopping £22,000 in August.
The result has been a positive one, with used Tesla cars selling faster than any other in the market, taking an average of just 19 days.
More broadly, EVs are taking longer to sell than any other fuel-type. However, the average number of days it takes for them to leave forecourts is falling steadily as they become ever more affordable, dropping from 42 days in May, to 38 days in June.
Both petrol and diesel cars remained flat over the same period at 27 days.
Walker added: “Although EV values are still contracting, it’s important to put it into the right context.
“The electric market is still an immature one, and what we’re seeing is a natural and expected correction in the wake of a massive influx of stock over recent months.
“It may be some time before the market reaches a complete equilibrium, but we are seeing clear signs of prices stabilising and some very attractive savings for car buyers.
“It means that for retailers who are able to follow the data, and source the right electric stock for their forecourt, there’s some very strong profit potential out there.”


Login to comment
Comments
No comments have been made yet.